How do we evaluate an “Investment Plan”? The opinion of the “Average Joe off the street”

Let us assume that you are not an Accounting & Finance professional, but you want to evaluate a proposed Investment Plan. You don’t know a method to do it, and you have found out that there is no relevant article in Wikipedia (as discussed in a previous article). You have asked for the opinion of many seasoned professionals and you have read several books on the subject. However, in both cases, you got a complicated and rather incomprehensible answer, that has left you more mixed up than you were before you started.

Eventually, you have given up hope that you can get an answer that you can understand. Then you decide to do something radical. You ask the “average Joe off the street” how he would evaluate an “Investment Plan”. The answer that you are most likely to get, will probably look like this: 

  • With this hand, I take “X amount” out of my pocket, and I give it, so that the new investment can be created.
  • With the other hand, throughout the years, I receive “Y amount” from the new investment.
  • I compare the “amount that I give” with the “amount that I receive”.

That’s the kind of answer that you’ll probably get from the “Average Joe off the street”. The only comment that I can make about it, is that there’s not a single thing in it that’s wrong. All of it, is 100% on target. Bullseye.

So, now that we have found a way (that is understandable and makes sense) to evaluate an investment, let us try to implement it, on a practical level. My first reaction to that will probably be: “Not so fast. The theory might be simple, but the implementation is not”.

There are two values that we must calculate: “what we give” and “what we receive”. The “give” part is usually the most easy to establish. In the most difficult scenario, the equity will be contributed in two or three installments, or the investor will also contribute the use of a building or of a truck etc. The complicated value is the “receive” part.

First of all, let us understand what the investor does not receive. He doesn’t receive:

  • Every individual cashflow that will take place (collections and payments). That might be the basic idea behind NPV and IRR, but the truth is that it has no connection to reality.
  • “Earnings of Year 1”, “Earnings of Year 2” etc.

These are two notions that have created tons of confusion and must be scraped and forgotten ASAP.

What the investor really does receive is the following two things:

  • Incremental payments, such as dividends, withdrawal of equity etc, on the basis of the actual payment date.
  • The residual value of the investment, on the basis of the last day of the “Investment Evaluation Period”.

Let us make the assumption that in the created company, for “Fiscal Year 1”, that lasts from “Jan 1 2012” till “Dec 31 2012”, we have calculated (and not forecasted, as discussed in a previous article) that it will have “Net Earnings before Taxes” of 1,600,000. This is not what the investor will receive. The breakdown might look like this:

The investor will receive the dividends (500,000) on the date that they are actually paid (for example: on July 17 2013). The sums of the “Statutory Reserves”, “Extraordinary Reserves” and “Retained Earnings” are monies that are not distributed, but remain inside the company. They add up to the company’s residual value at the “End Date” of the “Evaluation Period”. Their sum, on some days:

  • Increases the positive “daily balance” of the Bank account, which results in more “Interest Income” (for example: at 0,50%)
  • Decreases the negative “daily balance” of the Bank account, which results in less “Interest Expense” (for example: at 6,00%)
  • On some days, it is the deciding factor that turns a negative “daily balance” of the Bank account (source of “Interest Expense”) into a positive “daily balance” (source of “Interest Income”)

The same effect, applies also to the dividends, until their payment date. Any accurate calculation method must be able to incorporate the above effect into the calculated final result. In previous articles, we have seen that this can never happen thru the NPV and the IRR methods.

The investor also receives the residual value of the investment (i.e. the valuation of the new company) at the “End Date” of the “Evaluation period”. That is the combined total of the following values:

  1. Balance of the Bank account
  2. Valuation of residual stock of Goods (products, merchandise, raw materials, packaging materials etc)
  3. Payments that will happen after the “End Date” of the “Evaluation period”, but are an integral part of it. Examples are: Payment of VAT for the last month, Payment of Income Tax for the last “Fiscal Year”, Payment of Dividends for the last “Fiscal Year”, outstanding payments to vendors etc
  4. Collections that will happen after the “End Date” of the “Evaluation period”, but are an integral part of it. Examples are outstanding collections from customers etc
  5. Market (resale) value of the existing equipment, buildings, cars etc

Only the last (fifth) category of values is a matter of forecast. The first four categories should always be the product of a calculation.

Stick around, as we are going to see how all this, is being handled by C2BII in a way that is easy to understand, implement and verify.


Posted in Budget, Budgeting, C2BII Instructions, Financial Analysis, Financial Analysis Method, Investment Plan Evaluation, Problems of Net Present Value | Tagged , , , , , , | Leave a comment

Calculation of profitability: The devil is in the details. Can 0.05% create an unacceptably high error margin?

Can a 0.05% have a material impact in an “Investment Plan Evaluation” scenario”? Almost all seasoned veterans will probably call it “peanuts”, categorize it as something that is “below materiality limit”, and not worth pursuing. Read on, because the answer will probably surprise and shock you, as much as it did me.

I used to strongly believe in the old saying, that in Financial Analysis, the person that thoroughly examines the nickels and the dimes, will probably let the 100 dollar bills pass in front of him without realizing what has happened. Or, in other words, if you spend too much time worrying about the small inconsequential values, you will probably forget to examine the large and most important ones. Actually, I still do believe in that saying.

The Greek Tax law 128/75 states that, on every last day of a calendar month, every Bank account gets examined. If the balance is positive (i.e. a deposit from the company to the Bank) nothing happens. If the balance is negative (i.e. a loan from the Bank to the company), then a Tax contribution is being collected. Its sum, is the balance of the Bank account on the month’s last calendar day, multiplied by 0.05%

I have yet to see anyone in commerce or industry, to include the Tax contribution of Law 128/75 in an “Investment Plan Evaluation” or an “Annual Budget” scenario. I imagine that it is conceivable that some people who work in the Banking sector might have done it, but I cannot be absolutely sure about that.

Recently, I conducted an “Investment Plan Evaluation” analysis, in a major Greek company, thru C2BII. In it, I decided to include the calculation for Law 128/75. In case you are wondering why I did it, my answer is: “because I could do it, and because I could be so accurate, with so little effort”. I fully expected that the company’s CFO would eventually make some comment about why I took the time to do it. I even had prepared an answer that went along the lines that, in C2BII, we have a system where the 100% accurate calculation is the fast and easy thing to do, while an approximation is more difficult and more time consuming to implement.

After I performed the profitability calculation, I started auditing the individual result numbers in order to see if anything looked out of place. When I first saw the calculated number for the Tax contribution of Law 128/75 my first reaction was to think that I had made a set-up mistake somewhere, because the number was way too large. Actually, the set-up and the calculated number were both correct. I tried to find a rational explanation for the size of the number that I was looking at. Then, it hit me. If you take a very big number and multiply it with an extremely small percentage, the result might not be spectacular, but it will definitely be “above materiality limit”.

To better understand this, let us assume that there is a Bank loan of 10,000,000€ involved, and that we examine the proposed investment on a 5 year basis. If you do the math, you will see that the total amount of the Law 128/75 Tax contribution comes to 300,000€. This is an expense figure that is way “above materiality limit”, and you definitely must not omit such expenses from your profitability calculation.

But wait. It can get worse.

Let us assume that the proposed investment’s profit, was calculated to be either a pessimistic 2,000,000€ or an optimistic 5,000,000€. Failing to register the 300,000€ expense from Law 128/75, results in an error margin that’s respectively 15% and 6%. I cannot find words to express how frustrating I find the fact that such a huge and unacceptable error margin can be created by such an insignificant percentage.

There’s no denying the old saying that “The devil is in the details”. The “little harmless looking things” that escape your notice, will eventually destroy your work. How many other “little harmless looking things”, like the Tax contribution of Law 128/75, are waiting around the corner? I really cannot answer that one for sure. Is there a method to protect ourselves and our work from such “Black Swans”? Without any hesitation, my answer is a loud YES.

In C2BII, we have the ability to create an accurate and controlled environment. You set up the way that every incident works, and then you let the system create a simulation of the Accounting books, or in other words, the only absolutely and undeniably accurate way to calculate “Profit & Loss”. It is like in experimental physics or experimental chemistry, where you insert the cause (example: “ingredient A” and “ingredient B”) in the controlled environment, and you wait to see the result that will come out. And if you expected the result to be a yellow liquid, but in reality you get a green gas, you start to reexamine your assumptions, in order to see what you have thought wrong. That is a (more or less) accurate analogy, to my discovery of the impact that was created by Law 128/75.

Stick around, as we are going to see how the “average Joe off the street” will evaluate an “Investment Plan”, and why that method is better than anything you can currently find in the Academic books.

Posted in Budget, Budgeting, CashFlow, Financial Analysis, Financial Analysis Method, Investment Plan Evaluation | Tagged , , , , , | Leave a comment

What is the basis of the method of C2BII? Part 7: Processing of “What if” scenarios thru “Variation Factors”

In an “Annual Budget” and in “Investment Plan Evaluation”, the initial work that we have created that calculates the profitability, is simply the starting point for the really important part of the Financial Analysis, which is the processing of “What if” scenarios. Examples of that, might be, what the profitability will look like:

  • if we make only 92% of the sales target
  • if the days of credit to the customers are 19 more than we anticipated
  • if the Interest rates do this
  • if the cost of TV advertisement does that
  • if the cost of raw materials does the other thing
  • if … if … if …

 It is important to understand that in the profitability calculation, changes do not come in a linear manner. For example: an increase in sales by 30% does not bring an increase in profitability by the same rate. As a matter of fact, in a specific scenario, it might be possible that it might bring a decrease in profitability by 10%. A huge number of relations exist between the relevant data. In practice, a simple to calculate answer is not feasible. One must recalculate everything from the start.

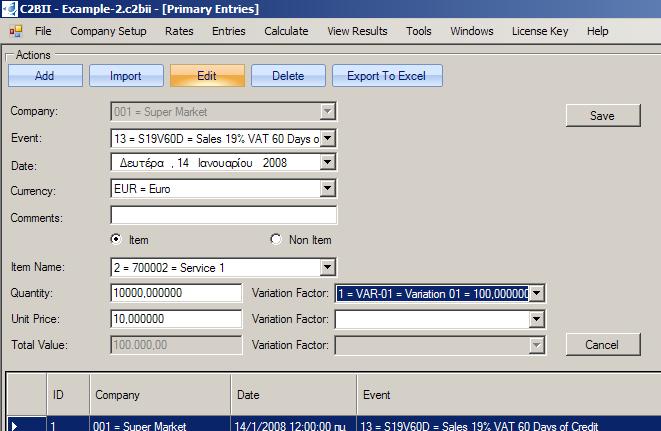
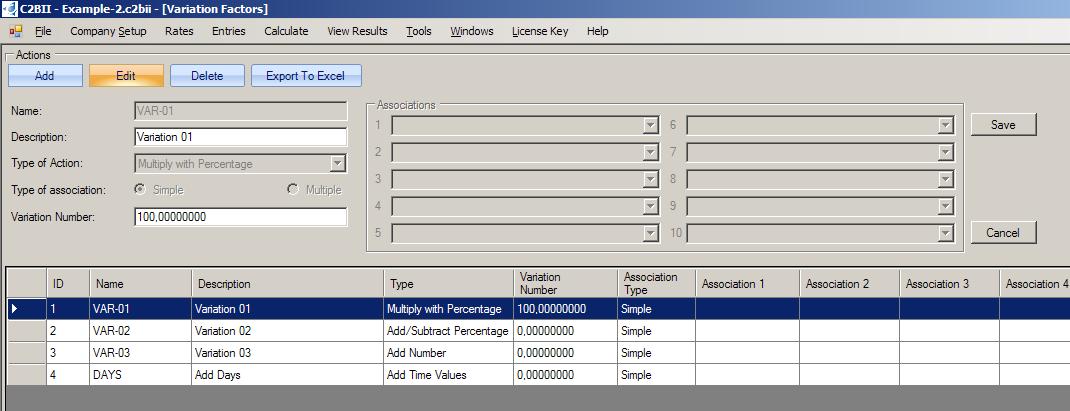
In C2BII the mechanism that we use to address those alternative scenarios is called “Variation Factors”. Every number that is being entered in the C2BII program (both “set-up data” and “data of forecasted values”) has the capability to be associated with a “Variation Factor”.

That association is “non mandatory”. The choice whether it should be utilized at all, and if so, in what manner, is a matter of creative thinking and depends on one’s knowledge of the company’s present practices, and the ability to foresee what might be useful in a novel future situation.

A “Variation Factor”, in its most simple form, is the combined impact of two pieces of information. The first is a “Variation Number” and the second is a “Type of Action”.

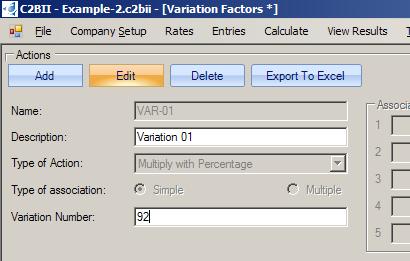
The suggested method (and foreseeable the most common situation) is for “Variation Factors” to be created so that initially they enforce no change to the numerical values they have been associated with. Let us say that an entry with a value of 10,000 is associated with a “Variation Factor”, whose “Type of Action” is “Multiply with Percentage”, and its “Variation Number” is 100. In practice nothing changes, because any number multiplied with 100% remains the same. However, if one wishes to turn that number into 92% of its original value, then the “Variation Number” should be changed into 92. By that, during the calculation process, the original value of 10,000 will turn into 9,200. Every value that is a product of a calculation (examples: “Payment of VAT”, “Interest Income”, “Interest Expense”, “Income Tax” etc) will be calculated again with the new forecasted numbers. Then, all that the user has to do, is to examine the difference between the new and the old profitability results.

Stick around, as we are going to see the perils of thinking that we can ignore aspects of the calculation process, and thru abstraction, focus our attention only on the big numbers and the big issues.

Posted in Budget, Budgeting, C2BII Instructions, CashFlow, Financial Analysis, Financial Analysis Method, Investment Plan Evaluation | Tagged , , , , , , | Leave a comment